This comprehensive S&P 500 weekday performance analysis explores over two decades of market behavior to determine if certain weekdays consistently outperform others. By examining opening and closing prices from 2000 to 2024, the study identifies potential patterns in the S&P 500 weekday performance analysis that traders and investors can use.
Understanding weekday patterns can offer investors and traders an edge in timing entries and exits, managing risk, and building more robust trading models. While calendar effects such as the “Monday effect” or “Turn-of-the-month effect” are widely discussed in financial literature, this study takes a granular look at weekday-specific performance across multiple market conditions, including bull markets, bear markets, and periods of high volatility.
Data and Methodology
Dataset
- Instrument: S&P 500 Index
- Timeframe: January 1, 2000 – December 31, 2024
- Frequency: Daily (Monday through Friday trading days only)
- Source: Historical open and close data
Metrics Calculated
- Daily Performance:
Return = Close / Close of previous day
Calculated for each trading day, then grouped by weekday. - Average Return by Weekday:
Mean of daily performance for each weekday across all years and per year. - Volatility (Standard Deviation):
Standard deviation of daily returns by weekday, to measure risk associated with each day. - Visualization & Color Coding:
- Green shades: Higher performance / lower volatility
- Red shades: Lower performance / higher volatility
- Used to visually identify patterns across time and days
S&P 500 Weekday Performance Analysis
📈 Average Daily Performance (2000–2024)
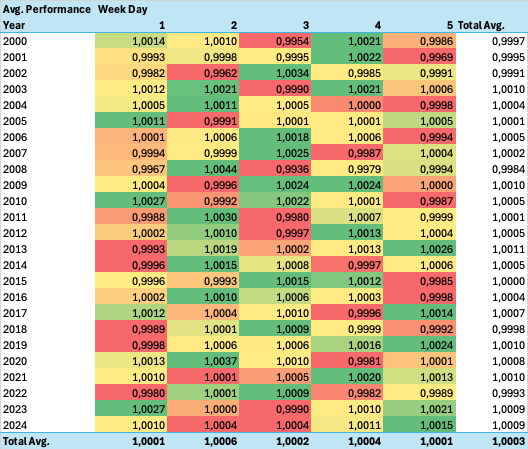
- The highest average performance across all years was observed on Tuesday (1.0006) and Tursday (1.0004).
- Monday (1.0001) and Friday (1.0001) also show marginally positive average returns, but generally lower than mid-week.
- Wednesday (1.0002) shows variability but still leans positive.
- The overall average daily return for the 25-year period is 1.0003 (equivalent to an average daily gain of 0.03%).
🔍 Key Observations:
- Monday underperformance is present in multiple years, consistent with the “Monday Effect” where markets tend to underperform at the beginning of the week due to pessimism or weekend news digestion.
- Tuesdays to Thrusdays often reflect relatively stronger performance, possibly due to mid-week market stabilization and end-of-week positioning by institutional investors.
- The last two years experienced sharp deviations form the average as Monday and Friday are the overperformer and mid weeks are lower than average.
📊 Volatility by Weekday (2000–2024)
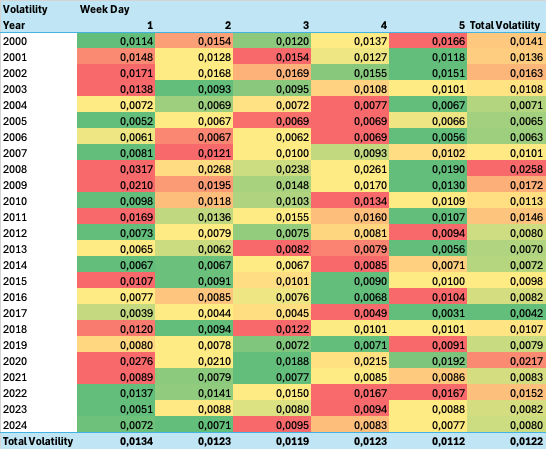
- The lowest average volatility across all years is on Friday (0.0112) and Wednesday (0.0119).
- Monday (0.0134), Tuesday and Thursday (0.0123) tend to show higher volatility, perhaps reflecting uncertainty from weekend news or positioning ahead of the weekend.
🔍 Volatility Insights:
- In high-volatility years (e.g., 2008, 2020), weekday differences become more pronounced. For example, in 2020, Monday volatility was 0.0276 vs. Friday’s 0.0192.
- In stable years (e.g., 2017), all weekdays show low and fairly even volatility.
- Overall, Wednesdays appear favorable, combining low volatility with high average returns.
S&P 500 Weekday Trend Analysis Over Time
The study reveals evolving patterns:
- 2000–2010: Clearer weekday biases, especially underperformance on Mondays and outperformance midweek.
- 2011–2024: A gradual reduction in weekday discrepancies, suggesting increasing market efficiency. The impact of algorithmic and high-frequency trading may have arbitraged away some of the more predictable patterns.
- Crisis periods (2008, 2020): Amplify both return and volatility disparities across weekdays, showing how behavior shifts under stress.
Implications for Investors
✅ Practical Takeaways
- Wednesday emerges as the most favorable weekday over the long term, offering both above-average returns and below-average volatility.
- Friday also offers consistent gains in recent years, potentially due to weekly rebalancing and closing trades.
- Monday remains a cautious entry point, especially during turbulent years.
- Traders could optimize strategies (e.g., swing trading or mean reversion) by aligning with favorable weekdays.
❗ Limitations & Considerations
- Transaction costs, taxes, and slippage were not included, which could impact real-world applicability of short-term timing based on weekday patterns.
- These patterns are not strong enough in isolation to guarantee alpha — they should be used as supplementary timing tools within a broader strategy.
- Past performance is not indicative of future results; patterns observed historically may not persist.
Conclusion
This comprehensive weekday analysis of the S&P 500 reveals measurable, albeit modest, differences in average return and risk across trading days. While traditional weekday anomalies like the “Monday Effect” have diminished over time, Wednesdays and Fridays continue to show relatively stronger performance, both in terms of returns and lower volatility.
These insights can help investors and traders refine tactical decisions, improve risk-adjusted returns, and better understand the microstructure of market behavior. The long-term data also underscores the importance of adaptive strategies, as market efficiency and structure continue to evolve.